erika artaker
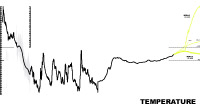
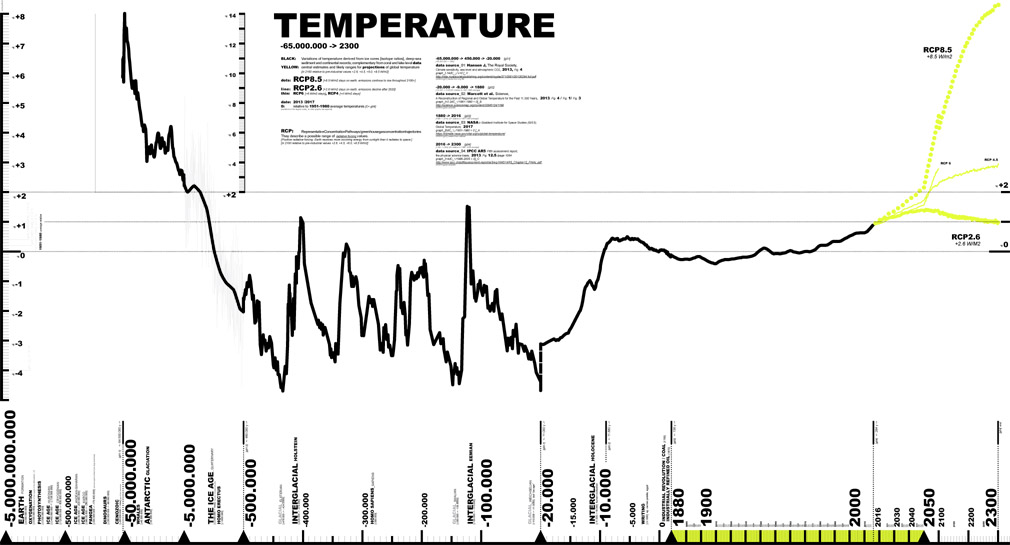
TEMPERATURE
subtitle
world
date
2017 10 [source 2013 / 2017]
caption
-65.000.000 -> 2300
BLACK: Variations of temperature derived from ice cores [isotope ratios], deep-sea sediment and continental records; complementary from coral and lake level data
YELLOW: central estimates and likely ranges for projections of global temperature
dots: RCP8.5 [+8.5 W/m2 stays on earth, emissions continue to rise throughout 2100+
line: RCP2.6 [+2.6 W/m2 stays on earth, emissions decline after 2020
thin: RCP6 [+6 W/m2] RCP4 [+4 W/m2]
[in 2100 relative to pre-industrial values +2.6, +4.5, +6.0, +8.5 W/m2]
date: 2013 / 2017
0: relative to 1951-1980 average temperatures
[variations in the degree scale_ to other graphs see appendix]
data source
-65.000.000 -> 450.000 -> -20.000 [g01] _
Hansen J, The Royal Socieyt, Climate sensitivity, sea level and atmospheric carbon dioxide, 2013 , Fig. 4,
[x = 0]_X
GRAPH [g01] traced from img file
http://rsta.royalsocietypublishing.org/content/roypta/371/2001/20120294.full.pdf
-20.000 -> -9.000 -> 1880 [g02] _
Marcott et al., Science, A Reconstruction of Regional and Global Temperature for the Past 11.300 Years, 2013, Fig.4 / Fig.1 / Fig.3,
[1961-1990 = 0]_B
GRAPH [g02] vectorfile
http://science.sciencemag.org/content/339/6124/1198
1880 -> 2016 [g03] _
NASA‘s Goddard Institute for Space Studies (GISS), Global Temperature, 2017,
[1951-1980 = 0 ]_A [same 0 as this graph]
GRAPH [g03] created from dataset
https://climate.nasa.gov/vital-signs/global-temperature/
2016 -> 2300 [g04] _
IPCC AR5 Fifth assesement, the physical science basis- chapter 12, 2013,Fig. 12.5./page 1054,
[1986-2005 = 0]_C
GRAPH [g04] vectorfile
http://www.ipcc.ch/pdf/assessment-report/ar5/wg1/WG1AR5_Chapter12_FINAL.pdf
 < 1.1
< 1.1 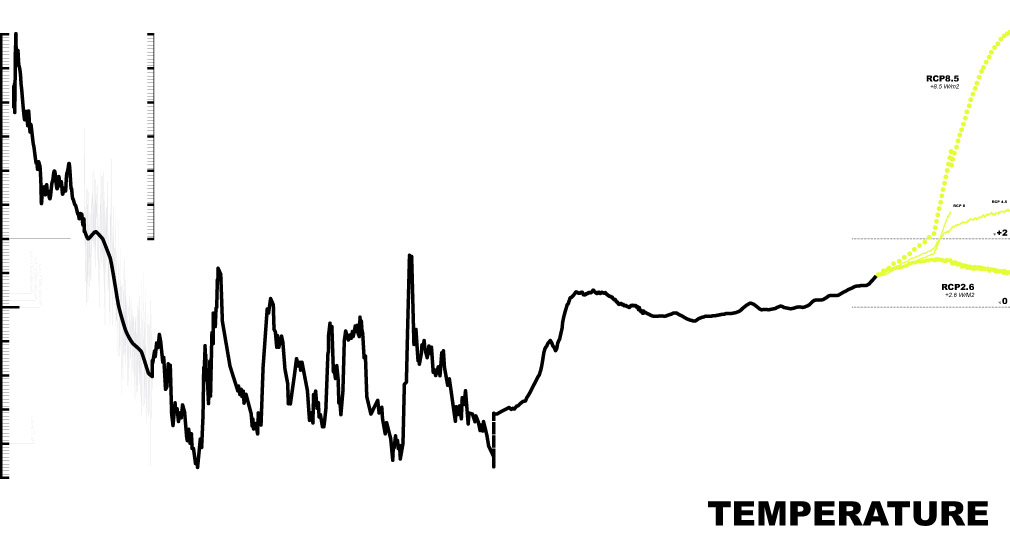 < 1.2
< 1.2title
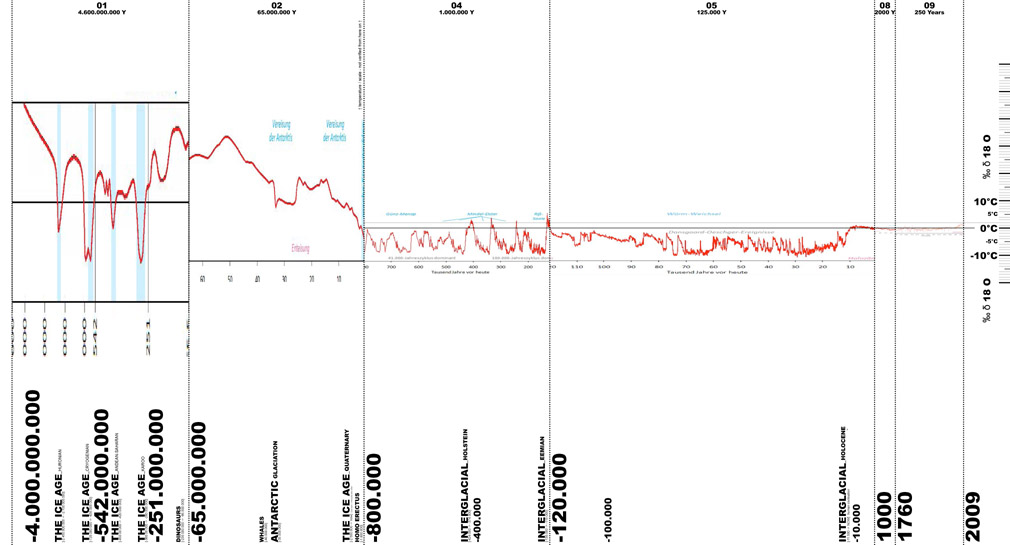
TEMPERATURE
subtitle
north hemisphere/ ZAMG / collage
date
2019 03 [source diverse]
caption
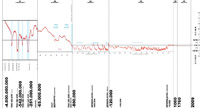
-4.600.000.000 -> 2009
data source
ZAMG The Central Institution for Meteorology and Geodynamics (German: Zentralanstalt für Meteorologie und Geodynamik, ZAMG)
https://www.zamg.ac.at/cms/de/klima/informationsportal-klimawandel/klimavergangenheit/palaeoklima
9 8 5 4 2 1
-4.600.000.000 ->-65.000.000 [g01] _
Saltzmann [mod.], Idealisierter Verlauf der globalen Mitteltemperatur basierend auf geologischen Proxydaten dargestellt über einer variablen Zeitskala, 2000 , Fig. 1
0=
GRAPH [g01] traced from img file
https://www.zamg.ac.at/cms/de/klima/informationsportal-klimawandel/klimavergangenheit/palaeoklima/4-6-mrd.-jahre
-65.000.000 -> -800.000 [g02] _
Zachos et al. [mod.], Temperaturrekonstruktion des Känozoikums aus Sauerstoffisotopen,, 2001, Fig.1
0=
GRAPH [g01] traced from img file
https://www.zamg.ac.at/cms/de/klima/informationsportal-klimawandel/klimavergangenheit/palaeoklima/65-mio.-jahre
-800.000 -> -120.000 [g04] _
Lisiecki und Raimo, 1,5 Mio. Jahre aus Tiefseebohrkernen 2005, Fig.1
0=
GRAPH [g01] traced from img file
https://www.zamg.ac.at/cms/de/klima/informationsportal-klimawandel/klimavergangenheit/palaeoklima/1-mio.-jahre
-120.000 -> 1000 [g05] _
NGRIP members, 2004, Berger, 200 ; Die letzte Kaltzeit in Grönland und den Alpen. Rekonstruierter Temperaturverlauf aus einem nordgrönländischen Eisbohrkern zusammen mit dem Klimaantrieb der Zyklen der Erdbahnparameter, Fig. 1,
0=
GRAPH [g01] traced from img file
https://www.zamg.ac.at/cms/de/klima/informationsportal-klimawandel/klimavergangenheit/palaeoklima/125.000-jahre
1.000 -> 1760 [g08] _
Moberg et al., 2005, ergaenzt durch: Brohan et al., 2006 ;Kombination unterschiedlicher natürlicher und historischer Proxies für das Jahresmittel der gesamten Nordhemisphäre, Fig. 1,
0=
GRAPH [g01] traced from img file
https://www.zamg.ac.at/cms/de/klima/informationsportal-klimawandel/klimavergangenheit/palaeoklima/2.000-jahre
1760 -> 2009 [g09] _
0=
GRAPH [g01] traced from img file
https://www.zamg.ac.at/cms/de/images/klima/bild_ip-klimawandel/klimavergangenheit/palaeoklima/3-1_2_zeitreise
 < 1.1
< 1.1title
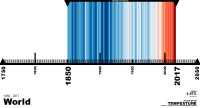
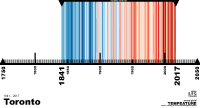
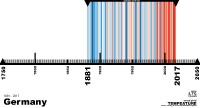
TEMPERATURE
subtitle
color_Ed Hawkins
date
2018 07 [source 2018]
caption
~1800 -> 2300
data source
adapted from visualisations by: Ed Hawkins
http://www.climate-lab-book.ac.uk/2018/warming-stripes/
World_https://www.metoffice.gov.uk/hadobs/hadcrut4/
Toronto_https://www.canada.ca/en/environment-climate-change/services/climate-change/science-research-data/climate-trends-variability/adjusted-homogenized-canadian-data/surface-air-temperature-access.html
Germany_http://www.climate-lab-book.ac.uk/2018/warming-stripes/
December 27th, 2022