appendix
SEA LEVELG_ 1 – 5
5
DATA SOURCE
5_1 1700 -> 2100 [g01]
data source:
IPCC AR5, Fifth Assessment Report_climate change 2013: the physical science basis
Fig. 13.27./page 1204
IPCC AR5, Fifth Assessment Report_climate change 2013: the physical science basis
Fig. 13.27./page 1204
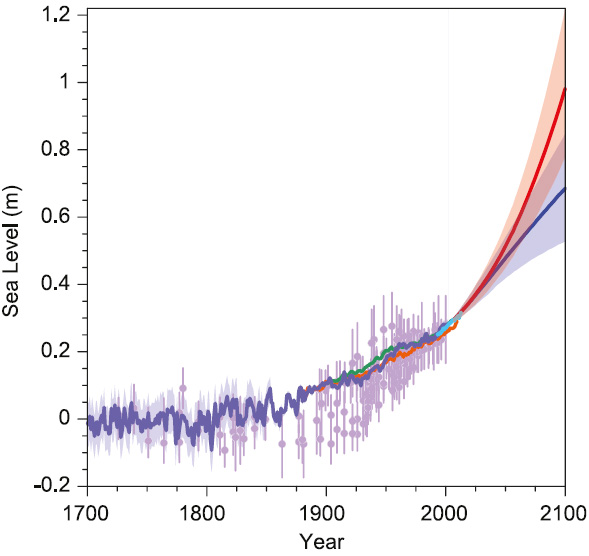
Compilation of paleo sea level data, tide gauge data, altimeter data (from Figure 13.3), and central estimates and likely ranges for projections of global mean sea level rise for RCP2.6 (blue) and RCP8.5 (red) scenarios (Section 13.5.1), all relative to pre-industrial values.
REPORT_chapter13_
https://www.ipcc.ch/pdf/assessment-report/ar5/wg1/WG1AR5_Chapter13_FINAL.pdf
IMGSCR_
http://www.ipcc.ch/report/graphics/index.php?t=Assessment%20Reports&r=AR5%20-%20WG1&f=Chapter%2013
https://www.ipcc.ch/pdf/assessment-report/ar5/wg1/WG1AR5_Chapter13_FINAL.pdf
IMGSCR_
http://www.ipcc.ch/report/graphics/index.php?t=Assessment%20Reports&r=AR5%20-%20WG1&f=Chapter%2013
5_1_1 1700 -> 2100
Ddata source::
IPCC AR5Fifth Assessment Report_climate change 2013: the physical science basis
Fig. 13.3./page 1147
IPCC AR5Fifth Assessment Report_climate change 2013: the physical science basis
Fig. 13.3./page 1147
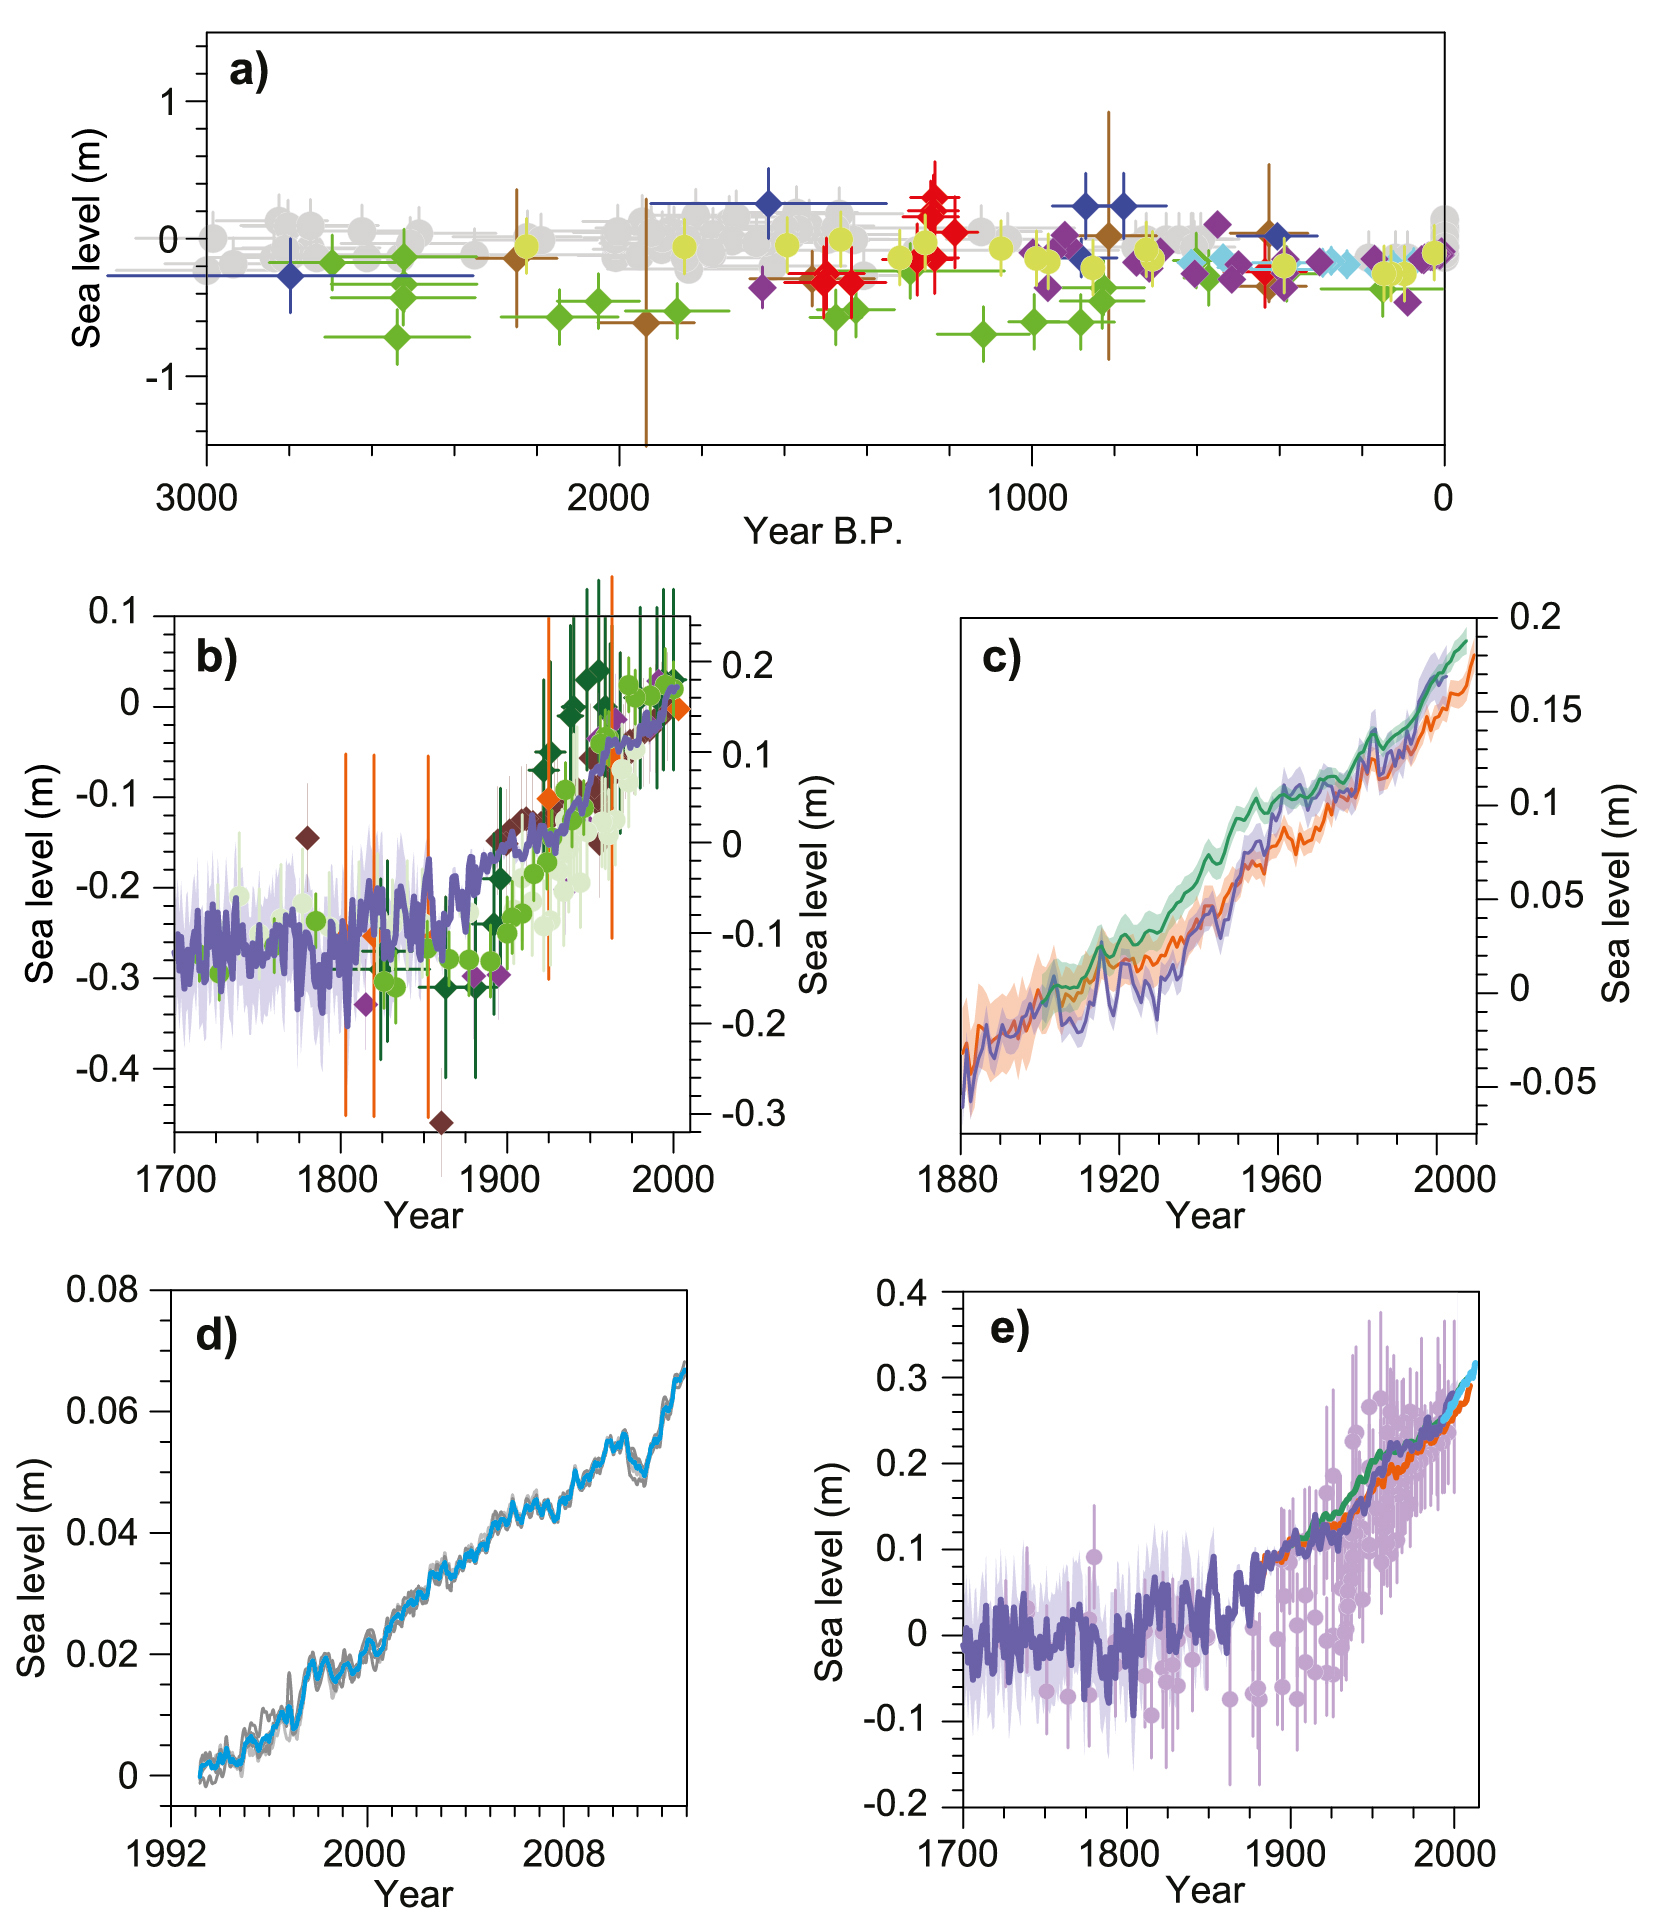
(e) Comparison of the paleo data from salt marshes
(purple symbols, from (b)),
with tide gauge and altimetry data sets (same line colours as in (c) and (d)).
purple = Nova Scotia (Gehrels et al., 2005),
bright blue = Connecticut (Donnelly et al., 2004),
blue = Nova Scotia (Gehrels et al., 2005),
________
(a) Paleo sea level data for the last 3000 years from Northern and Southern Hemisphere sites. The effects of glacial isostatic adjustment (GIA) have been removed from these records.
Light green = Iceland (Gehrels et al., 2006),
purple = Nova Scotia (Gehrels et al., 2005),
bright blue = Connecticut (Donnelly et al., 2004),
blue = Nova Scotia (Gehrels et al., 2005),
red = United Kingdom (Gehrels et al., 2011),
green = North Carolina (Kemp et al., 2011),
brown = New Zealand (Gehrels et al., 2008),
grey = mid-Pacific Ocean (Woodroffe et al., 2012).
(b) Paleo sea level data from salt marshes since 1700 from Northern and Southern Hemisphere sites compared to sea level reconstruction from tide gauges (blue time series with uncertainty) (Jevrejeva et al., 2008).
The effects of GIA have been removed from these records by subtracting the long-term trend (Gehrels and Woodworth, 2013). Ordinate axis on the left corresponds to the paleo sea level data. Ordinate axis on the right corresponds to tide gauge data.
Green and light green = North Carolina (Kemp et al., 2011),
orange = Iceland (Gehrels et al., 2006),
purple = New Zealand (Gehrels et al., 2008),
dark green = Tasmania (Gehrels et al., 2012),
brown = Nova Scotia (Gehrels et al., 2005).
(c) Yearly average global mean sea level (GMSL) reconstructed from tide gauges by three different approaches.
Orange from Church and White (2011),
blue from Jevrejeva et al. (2008),
green from Ray and Douglas (2011) (see Section 3.7).
(d) Altimety / satelite data sets from five groups (University of Colorado (CU), National Oceanic and Atmospheric Administration (NOAA), Goddard Space Flight Centre (GSFC), Archiving, Validation and Interpretation of Satellite Oceanographic (AVISO), Commonwealth Scientific and Industrial Research Organisation (CSIRO)) with mean of the five shown as bright blue line (see Section 3.7).
All paleo data were shifted by mean of 1700–1850 derived from the Sand Point, North Carolina data. The Jevrejeva et al. (2008) tide gauge data were shifted by their mean for 1700–1850; other two tide gauge data sets were shifted by the same amount. The altimeter time series has been shifted vertically upwards so that their mean value over the 1993–2007 period aligns with the mean value of the average of all three tide gauge time series over the same period.
REPORT_chapter 13_
https://www.ipcc.ch/pdf/assessment-report/ar5/wg1/WG1AR5_Chapter13_FINAL.pdf
IMGSCR_
http://www.ipcc.ch/report/graphics/index.php?t=Assessment%20Reports&r=AR5%20-%20WG1&f=Chapter%2013
https://www.ipcc.ch/pdf/assessment-report/ar5/wg1/WG1AR5_Chapter13_FINAL.pdf
IMGSCR_
http://www.ipcc.ch/report/graphics/index.php?t=Assessment%20Reports&r=AR5%20-%20WG1&f=Chapter%2013
4
WHAT IS
4_1 RADIATIVE FORCING
is the difference between enegry that stays on earth [sunligh / insolation absorbed by the Earth] and energy radiated back to space.
Positive radiative forcing means Earth receives more incoming energy from sunlight than it radiates to space.
This net gain of energy will cause warming.
Positive radiative forcing means Earth receives more incoming energy from sunlight than it radiates to space.
This net gain of energy will cause warming.
4_2 RCP
Representative Concentration Pathways
greenhouse gas concentration trajectories
greenhouse gas concentration trajectories
PRPs describe a possible range of radiative forcing values.
[Positive radiative forcing: Earth receives more incoming energy from sunlight than it radiates to space.]
[in 2100 relative to pre-industrial values +2.6, +4.5, +6.0, +8.5 W/m2]
[Positive radiative forcing: Earth receives more incoming energy from sunlight than it radiates to space.]
[in 2100 relative to pre-industrial values +2.6, +4.5, +6.0, +8.5 W/m2]
RCP 8.5 [green house gas emissions continue to rise throughout 2100+]
RCP 6 [GHGe peak around 2060]
RCP 4.5 [GHGe peak around 2040]
RCP 2.6 [GHGe peak around 2020]
RCP 6 [GHGe peak around 2060]
RCP 4.5 [GHGe peak around 2040]
RCP 2.6 [GHGe peak around 2020]
4_2_1 RCP_ROADMAP_PAPER
Rockström et al, Science, 2017
A roadmap for rapid decarbonization
Science 24 Mar 2017: Vol. 355, Issue 6331, pp. 1269-1271, DOI: 10.1126/science.aah3443
2017–2020: No-Brainers
2020–2030: Herculean Efforts
2030–2040: Many Breakthroughs
2040–2050: Revise, Reinforce
A roadmap for rapid decarbonization
Science 24 Mar 2017: Vol. 355, Issue 6331, pp. 1269-1271, DOI: 10.1126/science.aah3443
2017–2020: No-Brainers
2020–2030: Herculean Efforts
2030–2040: Many Breakthroughs
2040–2050: Revise, Reinforce
PAPER_hhttp://science.sciencemag.org/content/355/6331/1269
PAPER_PDF_http://www.rescuethatfrog.com/wp-content/uploads/2017/03/Rockstrom-et-al-2017.pdf
PAPER_PDF_http://www.rescuethatfrog.com/wp-content/uploads/2017/03/Rockstrom-et-al-2017.pdf
4_2_1_1 RCP_ ROADMAP_ARTICLE
Scientists made a detailed “roadmap” for meeting the Paris climate goals -It’s eye-opening . vox . 2017 03 24
4_2_2 RCP - ROADMAP_SEI
SEI [Stockholm Environment Institute]
A guide to Representative Concentration Pathways
A guide to Representative Concentration Pathways
RCPs are the latest generation of scenarios that provide input to climate models.
RCP 8.5 [continue to rise 2100+]
. Three times today’s CO2 emissions by 2100
. Rapid increase in methane emissions
. Increased use of croplands and decline in grasland which is driven by an increase in population
. A world population of 12 billion by 2100
. Lower rate of technology development
. Heavy reliance on fossil fuels
. High energy intensity
. No implementation of climate policies
RCP 6 peak 2060
. Heavy reliance on fossil fuels
. Intermediate energy intensity
. Increasing use of croplands and declining grasslands
. Stable methane emissions
. CO2 emissions peak in 2060 at 75%t above today’s levels, then decline to 25% above today
. Heavy reliance on fossil fuels
. Intermediate energy intensity
. Increasing use of croplands and declining grasslands
. Stable methane emissions
. CO2 emissions peak in 2060 at 75%t above today’s levels, then decline to 25% above today
RCP 4.5 peak 2040
. Lower energy intensity
. Strong reforestation programmes
. Decreasing use of croplands due to yield increases and dietary changes
. Stringent climate policies
. Stable methane emissions
. CO2 emissions increase only slightly before decline commences around 2040
. Lower energy intensity
. Strong reforestation programmes
. Decreasing use of croplands due to yield increases and dietary changes
. Stringent climate policies
. Stable methane emissions
. CO2 emissions increase only slightly before decline commences around 2040
RCP 2.6 peak 2020
. Declining use of oil . Low energy intensity . A world population of 9 billion by year 2100
. Use of croplands increase due to bio-energy production
. Less intensive animal husbandry . Methane emissions reduced by 40 %
. CO2 emissions stay at today’s level until 2020, then decline and become negative in 2100
. CO2 concentrations peak around 2020, followed by a modest decline to around 400 ppm by 2100
3
AGREEMENT
3_1
PARIS climate agreement is an agreement within the United Nations Framework Convention on Climate Change (UNFCCC) dealing with greenhouse gas emissions mitigation [Reduzierung], adaptation and finance starting in the year 2020.
signed 04 2016
end 2017 195UNFCCC members have signed the agreement [164 ratified it].
The contributions of the individual countries are called: NDCs - nationally determined contributions.
[CO2 emissions 2015: China 29.4%, US 14.3%, EEA 9.8%, India 6.8%, Russia 4.9%, Japan 3.5%, other 31.5%]
ARTICLE 3 requires them to be ambitious. Each further ambition should be more ambitious than the previous one, known as the principle of progression.
The specific climate goals are politically encouraged, rather than legally bound.
3_1_1 AIMS
A. Holding the increase in the global average temperature to well below 2 °C above pre-industrial levels and to pursue efforts to limit the temperature increase to 1.5 °C above pre-industrial levels, recognizing that this would significantly reduce the risks and impacts of climate change;
B. Increasing the ability to adapt to the adverse [nachteilig] impacts of climate change and foster climate resilience [Belastbarkeit] and low greenhouse gas emissions development, in a manner that does not threaten food production;
C. Making finance flows consistent with a pathway towards low greenhouse gas emissions and climate-resilient development.“ Countries furthermore aim to reach „global peaking of greenhouse gas emissions as soon as possible“.
3_1_2 START 2018 [-2025]
The global stocktake will kick off in 2018 with a facilitative dialogue, evaluation in 2025.
[parties will evaluate nearer-term goal and and the long-term goal of achieving net zero emissions after 2050+.]
The negotiators of the Agreement, however, stated that the NDCs and the 2 °C reduction target were insufficient;
instead, a 1.5 °C target is required, noting „with concern that the estimated aggregate greenhouse gas emission levels in 2025 and 2030 resulting from the intended nationally determined contributions do not fall within least-cost 2 °C scenarios but rather lead to a projected level of 55 gigatonnes in 2030“,
and recognizing furthermore „that much greater emission reduction efforts will be required in order to hold the increase in the global average temperature to below 2 °C by reducing emissions to 40 gigatonnes or to 1.5 °C“.
[in the first half of 2016 average temperatures were about 1.3 °C [although not the sustained temperatures over the long term which the Agreement addresses] .

2
RE_SOURCES
2_1 USGC
https://www.usgs.gov/
U.S. Geological Survey
The USGC provide science about the natural hazards that threaten lives and livelihoods; the water, energy, minerals, and other natural resources we rely on;
the health of our ecosystems and environment; and the impacts of climate and land-use change.
U.S. Geological Survey
The USGC provide science about the natural hazards that threaten lives and livelihoods; the water, energy, minerals, and other natural resources we rely on;
the health of our ecosystems and environment; and the impacts of climate and land-use change.
2_1_1 USGC_Report
data source:
USGCRP, 2017
Climate Science Special Report:
4 th National Climate Assessment, Volume I
[Wuebbles, D.J., D.W. Fahey, K.A. Hibbard, D.J. Dokken, B.C. Stewart, and T.K. Maycock (eds.)]
U.S. Global Change Research Program, Washington, DC, USA, 470 pp, doi: 10.7930/J0J964J6.
Chapter 12_Sea Level Rise
Chapter 13_Ocean Acidification and o...
Fig.12.2 b /Page 372
historical global mean sealevel
Fig. 13.1 /Page 66
Global Ocean heat content change time series
Fig. 13.4 /Page 372
CO2 concentrations, seawater pH, carbonate ion concentration
Oceans are RISING, WARMING, and Becoming More ACIDIC
2_1_1_1 RISING oceans
Chapter 12
Fig. 12.2 b
Oceans are RISING:
Global mean sea level (GMSL) has risen by about 7–8 inches (about 16–21 cm) since 1900, with about 3 of those inches (about 7 cm) occurring since 1993 (very high confidence)
Fig. 12.2 b
Oceans are RISING:
Global mean sea level (GMSL) has risen by about 7–8 inches (about 16–21 cm) since 1900, with about 3 of those inches (about 7 cm) occurring since 1993 (very high confidence)

Fig. 12.2b: GMSL rise from
_ −500 to 1900 CE:, Kopp et al.’s32 geological and tide gauge-based reconstruction (blue),
_ 1900 to 2010: Hay et al.’s33 tide gauge-based reconstruction (black),
_1992 to 2015: the satellite-based
reconstruction updated from Nerem et al.35 (magenta).
_ −500 to 1900 CE:, Kopp et al.’s32 geological and tide gauge-based reconstruction (blue),
_ 1900 to 2010: Hay et al.’s33 tide gauge-based reconstruction (black),
_1992 to 2015: the satellite-based
reconstruction updated from Nerem et al.35 (magenta).
2_1_1_2 WARMING oceans
Chapter 13
Fig. 13.1
Oceans are WARMING:
The world’s oceans have absorbed about 93% of the excess heat caused by greenhouse gas warming since the mid-20th century, making them warmer and altering global and regional climate feedbacks.(Very high confidence)
Fig. 13.1
Oceans are WARMING:
The world’s oceans have absorbed about 93% of the excess heat caused by greenhouse gas warming since the mid-20th century, making them warmer and altering global and regional climate feedbacks.(Very high confidence)

Fig. 13.1: Global Ocean heat content change time series. (Figure source: Cheng et al. 2017).
2_1_1_3 ACIDIC oceans from CO2
Chapter 13
Oceanes become ACIDIC
The world’s oceans are currently absorbing more than 1/4 of the CO2 emitted to the atmosphere annually from human activities, making them more acidic (very high confidence), with potential detrimental impacts to marine ecosystems.
The rate of acidification is unparalleled in at least the past 66 million years (medium confidence). Under the higher scenario (RCP8.5), the global average surface ocean acidity is projected to increase by 100% to 150% (high confidence).
Ocean acidity:
concentration of hydrogen ions H[+] in ocean seawater [regardless of ocean pH],
CO2(aq) + H2O ⇄ H2CO3
⇄ HCO [3−] + H [+]
⇄ CO3 [2−] + 2 H [+]
concentration of hydrogen ions H[+] in ocean seawater [regardless of ocean pH],
CO2(aq) + H2O ⇄ H2CO3
⇄ HCO [3−] + H [+]
⇄ CO3 [2−] + 2 H [+]
ACIDITY reduces the capacity of key plankton species and shelled animals to form and maintain shells. (USGCRP)

Fig. 13.4: Trends in surface (< 50 m) ocean carbonate chemistry calculated from observations obtained at the Hawai‘i Ocean Time-series (HOT) Program in the North Pacific over 1988–2015. (Figure source: NOAA).
2_1_1_3_1 ARTICLE
2017 12 26, The Guardian
US government climate report looks at how the oceans are buffering climate change
US government climate report looks at how the oceans are buffering climate change
2_1 IPPC
Intergovernmental Panel on Climate Change
The IPPC is a scientific and intergovernmental body [United Nations] it is , dedicated to the task of providing the world with an objective, scientific view of climate change and its political and economic impacts.
The IPPC is a scientific and intergovernmental body [United Nations] it is , dedicated to the task of providing the world with an objective, scientific view of climate change and its political and economic impacts.
2_1_1 IPPC_Reports
IPCC AR1 - AR5_Reports_all
https://www.ipcc.ch/publications_and_data/publications_and_data_reports.shtm
IPCC Special Reports_all
https://www.ipcc.ch/publications_and_data/publications_and_data_reports.shtml _Managing the Risks of Extreme Events and Disasters to Advance Climate Change Adaptation
_Carbon Dioxide Capture and Storage
_Emissions Scenarios
_Land Use, Land-Use Change, and Forestry
_...
2_1_1_1 IPPC AR5
PCC AR5_Fifth Assessment Report 2013/2014_full
REPORT_https://www.ipcc.ch/report/ar5/
IPCC AR5, 2013,
report 01_climate change 2013: the physical science basis
http://www.ipcc.ch/report/ar5/wg1
report 02_climate change 2014: Impacts, Adaptation, and Vulnerability
http://www.ipcc.ch/report/ar5/wg2/
report 03_climate change 2014: Mitigation of Climate Change
http://www.ipcc.ch/report/ar5/wg3/
report 04_climate change 2014: 2014: Synthesis Report
http://www.ipcc.ch/report/ar5/syr/
2_2 NASA
National Aeronautics and Space Administration
is an independent agency of the executive branch of the United States federal government [ t is not part of any executive department], responsible for the civilian space program, as well as aeronautics and aerospace research.
is an independent agency of the executive branch of the United States federal government [ t is not part of any executive department], responsible for the civilian space program, as well as aeronautics and aerospace research.
2_2_1 NASA . Sealevel
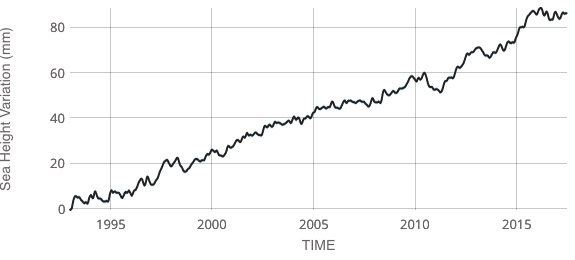
satelite data: 1993-present
Data source: Satellite sea level observations
Credit: NASA Goddard Space Flight Center
This dataset contains the Global Mean Sea Level (GMSL) trend generated from the Integrated Multi-Mission Ocean Altimeter Data for Climate Research (GMSL dataset).
Data source: Satellite sea level observations
Credit: NASA Goddard Space Flight Center
This dataset contains the Global Mean Sea Level (GMSL) trend generated from the Integrated Multi-Mission Ocean Altimeter Data for Climate Research (GMSL dataset).
2_2_2 NASA . Climate
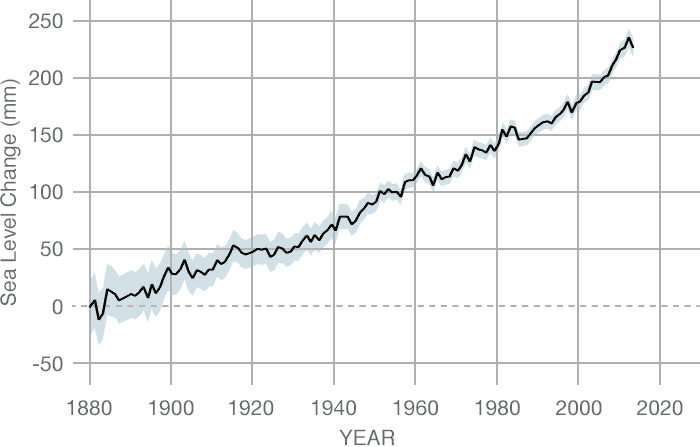
Ground data: 1870-2000
Data source: Coastal tide gauge records.
Credit: CSIRO
A spatial representation of the patterns of the global trends of the rising seas between 1993 and present. The figure was produced at the Jet Propulsion Laboratory (JPL), California Institute of Technology, under the NASA MEaSUREs program (version JPL 1603).
2_3 NOAA
National Oceanic and Atmospheric Administration
is an American scientific agency within the United States Department of Commerce that focuses on the conditions of the oceans and the atmosphere.
is an American scientific agency within the United States Department of Commerce that focuses on the conditions of the oceans and the atmosphere.
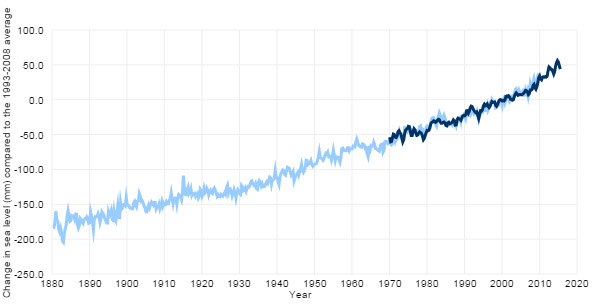
Global sea level since 1880
Data source: climate.gov
The light blue line shows seasonal (3-month) sea level estimates from Church and White (2011). The darker line is based on University of Hawaii Fast Delivery sea level data. For more detail on the data sources, see the end of the article.
Data source: climate.gov
The light blue line shows seasonal (3-month) sea level estimates from Church and White (2011). The darker line is based on University of Hawaii Fast Delivery sea level data. For more detail on the data sources, see the end of the article.
1
INFO
1_1 CAUSE
Sea level rise is caused primarily by these factors related to global warming:
40% .expansion of sea water as it warms
30% .water from mountain glaciers
20% .melting ice sheets
10% .land water [agriculture,..]
40% .expansion of sea water as it warms
30% .water from mountain glaciers
20% .melting ice sheets
10% .land water [agriculture,..]
1_2
Stefan Rahmstorf . German oceanographer and climatologist.
Since 2000, he has been a Professor of Physics of the Oceans at Potsdam University. He received his Ph.D. in oceanography from Victoria University of Wellington (1990).
His work focuses on the role of ocean currents in climate change. He was one of the lead authors of the IPCC Fourth Assessment Report.
https://en.wikipedia.org/wiki/Stefan_Rahmstorf
BLOG_http://www.realclimate.org/
UNIVERSITY_http://www.pik-potsdam.de/~stefan/
BLOG_http://www.realclimate.org/
UNIVERSITY_http://www.pik-potsdam.de/~stefan/
Rising Seas: How Fast, How Far
. Stefan Rahmstorf . 2016 05 25 . Earth101 . a part of series of lectures given at the University of Iceland*
. Stefan Rahmstorf . 2016 05 25 . Earth101 . a part of series of lectures given at the University of Iceland*
Is the Gulf Stream System Slowing?. Stefan Rahmstorf . 2016 05 25 . Earth101 . *
Extreme Weather: What Role Does Global Warming Play? . Stefan Rahmstorf . 2016 05 25. Earth101 . *
The Climate Crisis. Stefan Rahmstorf . 2013 10 05 . Earth101 . *
December 11th, 2025

