title
Energy Flow
subtitle
gaya
date
2025 10 [source 2023]
caption
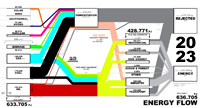
2023 WORLD_633.772 PJ [176.031 TWh]
date: 2023
units: PJ
CONVERSION 1 PT Petajoule = 0,27778 TWh 1 TWh terrawatthour = 3,6 PT
GRAPH / DIAGRAM: The graphical representation may differ slightly from the numbers due to rounding.Since the diagram is based on multiple sources, full consistency cannot be ensured.
in Italic: Numbers calculated from sources = Estimates
data source
IEA International Energy Agency
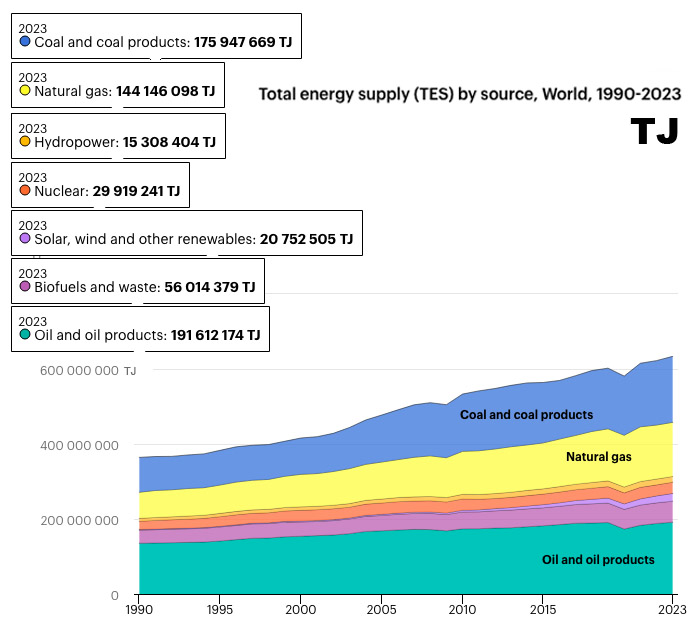
[g01] Total Energy SUPPLY [TES] by SOURCE, World 2023
https://www.iea.org/data-and-statistics/data-tools/energy-statistics-data-browser?country=WORLD&fuel=Energy%20supply&indicator=TESbySource
[g02-1] Total final CONSUMPTION by SECTOR, World 2023
https://www.iea.org/world/energy-mix
[g02-2] Total final CONSUMPTION by SOURCE, World 2023
https://www.iea.org/world/energy-mixy
 < 1.1 World Energy Flow 2023
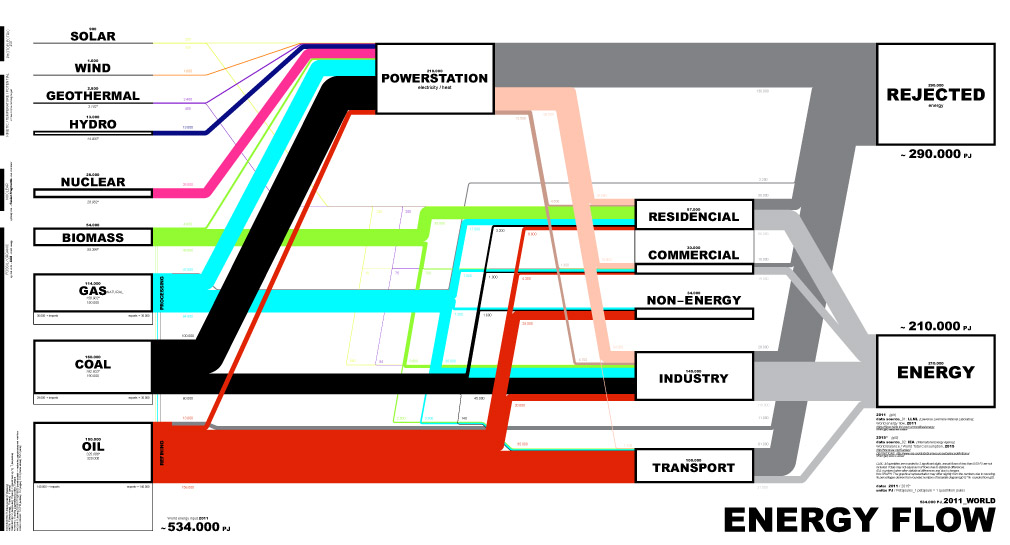 < 1.1 World Energy Flow 2011
title
ENERGY FLOW 1 – 5
5
DATA SOURCES
5_1 SOURCES
world / 2023
data source:
iea – International Energy Agency
data source:
iea – International Energy Agency
Energy Statistics Data Browser
https://www.iea.org/data-and-statistics/data-tools/energy-statistics-data-browser?country=WORLD
Global energy system, 2025 10
https://www.iea.org/world/
https://www.iea.org/data-and-statistics/data-tools/energy-statistics-data-browser?country=WORLD
Global energy system, 2025 10
https://www.iea.org/world/
5_2 ABOUT
Since the diagram is based on multiple sources, full consistency cannot be ensured.
in Italic: Numbers calculated from sources = Estimates
in Italic: Numbers calculated from sources = Estimates
5_3 CONVERSION
1 PJ Petajoule = 0,27778 TWh
1 TWh terrawatthour = 3,6 PT
1 TWh = 1000 Gwh
1 PJ = 1000 TJ
1 TWh terrawatthour = 3,6 PT
1 TWh = 1000 Gwh
1 PJ = 1000 TJ
4
ENERGY – SUPPLY
4_1 Total Energy Supply – 2023
GRAPH g01
world / 2023
Total Energy SUPPLY [TES] by SOURCE, World 2023
TOTAL:
633.705 PJ
176.031 TWh
world / 2023
Total Energy SUPPLY [TES] by SOURCE, World 2023
TOTAL:
633.705 PJ
176.031 TWh
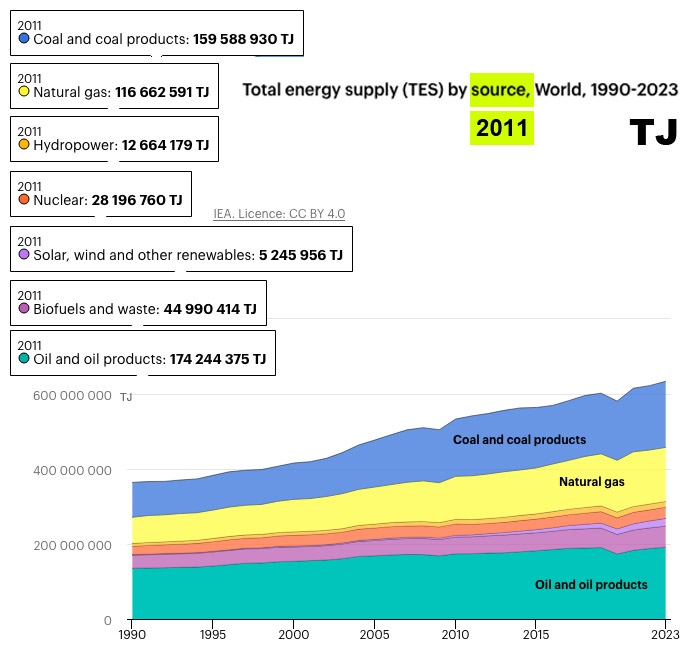
4_2 Total Energy Supply – 2011
GRAPH g01a
world / 2011
Total Energy SUPPLY [TES] by SOURCE, World 2011
TOTAL:
541.551 PJ
140.433 TWh
world / 2011
Total Energy SUPPLY [TES] by SOURCE, World 2011
TOTAL:
541.551 PJ
140.433 TWh
3
ENERGY - CONSUMPTION
3_1 Consumption – SECTOR
GRAPH g02-1
world / 2023
Total final CONSUMPTION by SECTOR, World 2023
TOTAL:
428.771 PJ
119.104 TWh
world / 2023
Total final CONSUMPTION by SECTOR, World 2023
TOTAL:
428.771 PJ
119.104 TWh
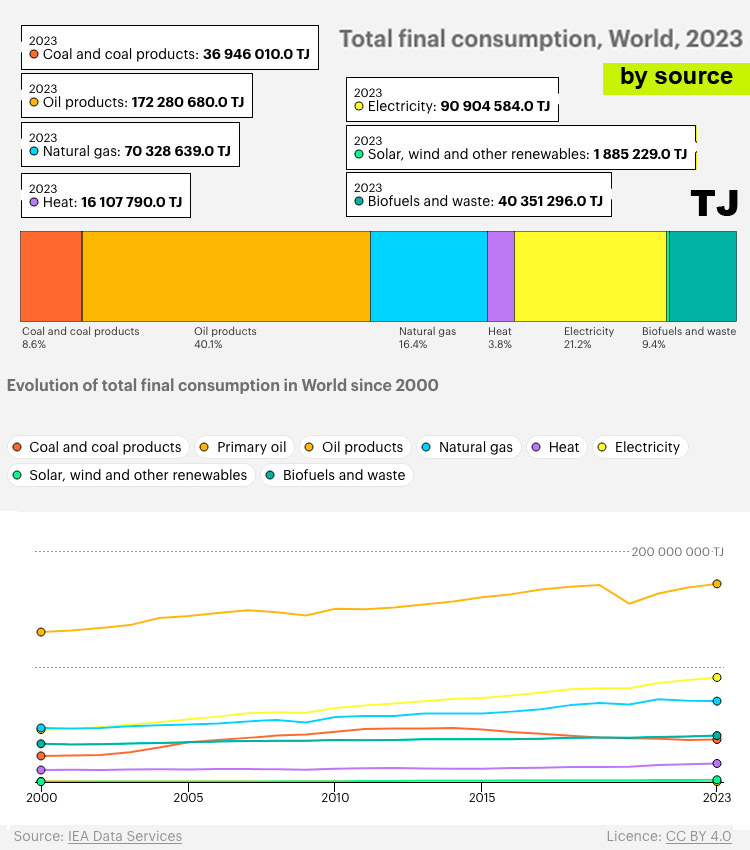
3_2 Consumption – SOURCE
GRAPH g02-2
world / 2023
Total final CONSUMPTION by SOURCE, World 2023
TOTAL:
426.919 PJ
118.590 TWh
TOTAL non Electricity:
336.014 PJ
93.338 TWh
world / 2023
Total final CONSUMPTION by SOURCE, World 2023
TOTAL:
426.919 PJ
118.590 TWh
TOTAL non Electricity:
336.014 PJ
93.338 TWh
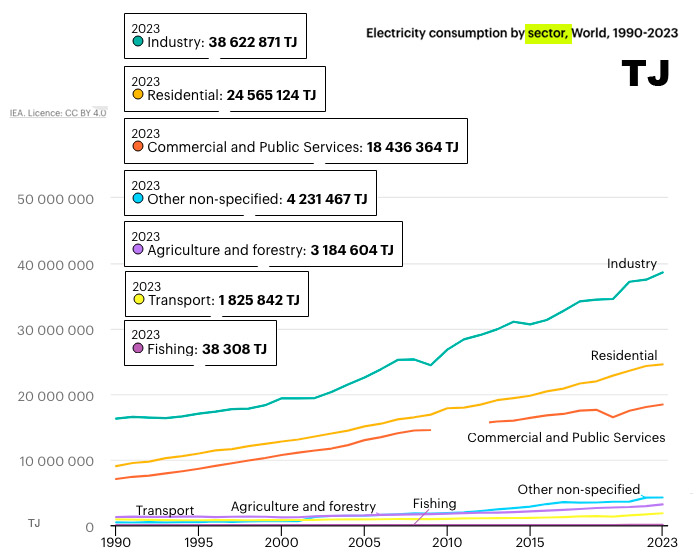
2
ELECTRICITY Consumption
2_1 e-Consumption – SECTOR
GRAPH g03-1
world / 2023
ELECTRICITY CONSUMPTION by SECTOR, World 2023
TOTAL:
90.866 PJ
25.241 TWh
world / 2023
ELECTRICITY CONSUMPTION by SECTOR, World 2023
TOTAL:
90.866 PJ
25.241 TWh
1
ELECTRICITY Generation
2_2 e-Generation – SOURCE
GRAPH g03-2
world / 2023
ELECTRICITY GENERATION by SOURCE, World 2023
TOTAL:
107.789 PJ
29.941.435 GWh
29.942 TWh
world / 2023
ELECTRICITY GENERATION by SOURCE, World 2023
TOTAL:
107.789 PJ
29.941.435 GWh
29.942 TWh

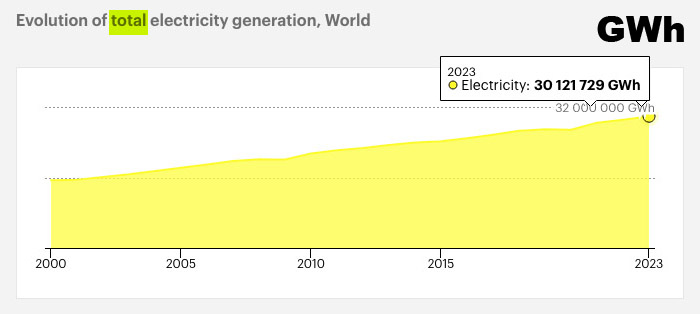
2_3 e-Total Generation
GRAPH g03-3
world / 2023
Total ELECTRICITY GENERATION, World 2023
TOTAL:
108.438 PJ
30.121.729 GWh
30.122 TWh
world / 2023
Total ELECTRICITY GENERATION, World 2023
TOTAL:
108.438 PJ
30.121.729 GWh
30.122 TWh
2_4 e-Renewable Generation – SOURCE
GRAPH g04
world / 2023
Renuable ELECTRICITY GENERATION by SOURCE, World 2023
TOTAL:
2.347 PJ
8.448.25 GWh
8.448 TWh
world / 2023
Renuable ELECTRICITY GENERATION by SOURCE, World 2023
TOTAL:
2.347 PJ
8.448.25 GWh
8.448 TWh
_SOURCE_diagram.jpg)
title
Energy Flow
subtitle
gaya
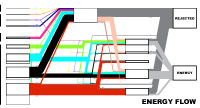
date
2018 01 [source 2011 / 2015*]
caption
2011 WORLD_534.000PJ /2015* [148.335 TWh]
date: 2011 / 2015*
units: PJ
CONVERSION 1 PJ Petajoule = 0,27778 TWh 1 TWh terrawatthour = 3,6 PJ
LLNL- graph: All quantities are rounded to 2 significant digits, annual flows of less than 0.05 PJ are not included. Totals may not equal sum of flows due to statistical differences.
IEA* - graph: numbers taken after statistical differences and stock changes.
this GRAPH: The graphical representation may differ slightly from the numbers due to rounding. % percentages deriven from rounded numbers of template diagram [g01]. * % rounded from g02
data source
2011 [g01] _
LLNL [Lawrence Livermore National Laboratory], World Energyflow, 2011
GRAPH [g01] created from numbers
https://flowcharts.llnl.gov/commodities/energy
2015* [g02] _
IEA [International Energy Agency], World Balance / World Total Consumption, 2015
GRAPH [g02] shown in numbers*
http://www.iea.org/Sankey/
< 1.1 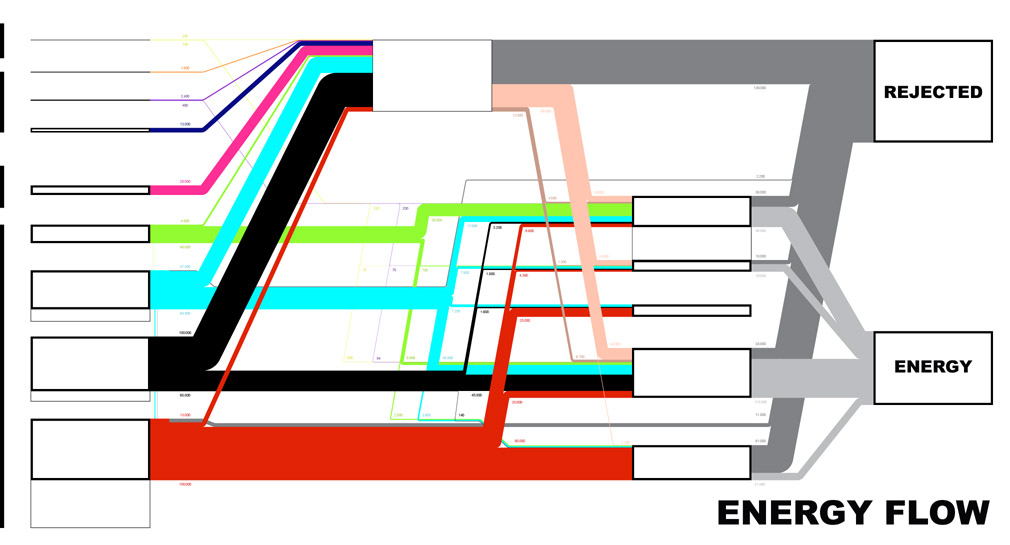 < 1.2
< 1.2
October 19th, 2025