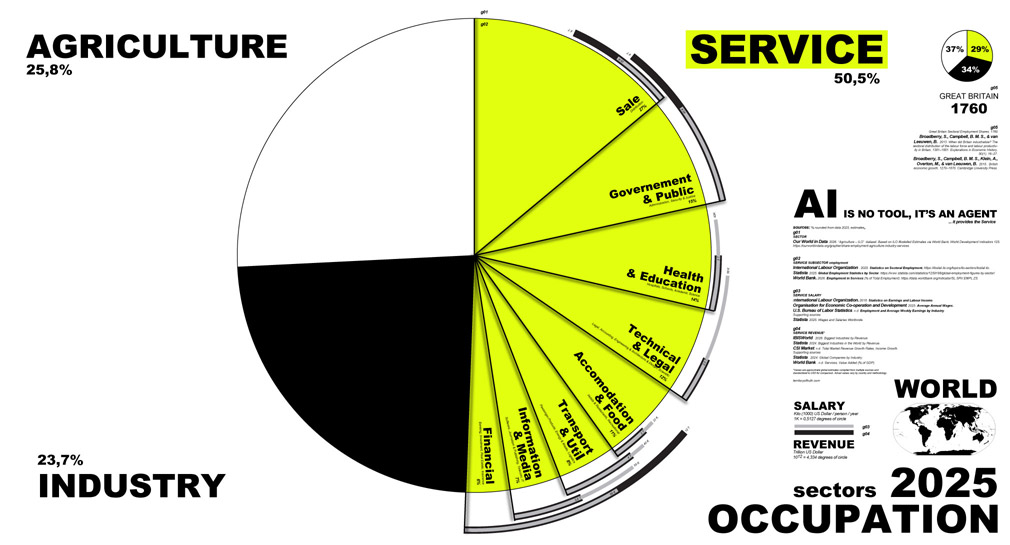
title
Occupation 2025

subtitle
AI is no Tool, it's an Agent
date
2026 05 [source 2025]
caption
Occupation 2025 WORLD_50% Service
year: 2025
units: Subsector % work, Sales: Kilo US Dollar, Revenue: Billion US Dollar
CONVERSION 1 K kilo = 1000 1 T trillion = 1.000.000.000.000 = 10↑ 12
GRAPH / DIAGRAM: The graphical representation may differ from the raw numbers due to rounding and the integration of multiple global datasets.
Since this visualization synthesizes diverse reporting standards, full consistency across all subsectors cannot be guaranteed.
data source
[g01]
Sector, World 2026
Our World in Data 2026. “Agriculture – ILO” dataset. Based on ILO Modelled Estimates via World Bank, World Development Indicators 125
https://ourworldindata.org/grapher/share-employment-agriculture-industry-services
[g02]
Service subsector employment, World 2025
International Labour Organization 2025. Statistics on Sectoral Employment
https://ilostat.ilo.org/topics/ilo-sectors/ilostat.ilo.
Statista 2025. Global Employment Statistics by Sectort
https://www.statista.com/statistics/1259198/global-employment-figures-by-sector/
World Bank 2026. Employment in Services (% of Total Employment)
https://data.worldbank.org/indicator/SL.SRV.EMPL.ZS.
[g03]
Service Salary estimates*, World 2025
International Labour Organization 2018. Statistics on Earnings and Labour Income.
Organisation for Economic Co-operation and Development 2025. Average Annual Wages
World Bank n.d. Employment and Average Weekly Earnings by Industry
< 1.1 World Energy Flow 2023
source
5
DATA SOURCES
5_1 SOURCES
world / 2023
data source:
iea – International Energy Agency
data source:
iea – International Energy Agency
Energy Statistics Data Browser
https://www.iea.org/data-and-statistics/data-tools/energy-statistics-data-browser?country=WORLD
Global energy system, 2025 10
https://www.iea.org/world/
https://www.iea.org/data-and-statistics/data-tools/energy-statistics-data-browser?country=WORLD
Global energy system, 2025 10
https://www.iea.org/world/
5_2 ABOUT
Since the diagram is based on multiple sources, full consistency cannot be ensured.
in Italic: Numbers calculated from sources = Estimates
5_3 CONVERSION
1 PJ Petajoule = 0,27778 TWh
1 TWh terrawatthour = 3,6 PT
1 TWh = 1000 Gwh
1 PJ = 1000 TJ
1 TWh terrawatthour = 3,6 PT
1 TWh = 1000 Gwh
1 PJ = 1000 TJ
4
ENERGY – SUPPLY
4_1 Total Energy Supply – 2023
GRAPH g01
world / 2023
Total Energy SUPPLY [TES] by SOURCE, World 2023
TOTAL:
633.705 PJ
176.031 TWh
world / 2023
Total Energy SUPPLY [TES] by SOURCE, World 2023
TOTAL:
633.705 PJ
176.031 TWh
4_2 Total Energy Supply – 2011
GRAPH g01a
world / 2011
Total Energy SUPPLY [TES] by SOURCE, World 2011
TOTAL:
541.551 PJ
140.433 TWh
world / 2011
Total Energy SUPPLY [TES] by SOURCE, World 2011
TOTAL:
541.551 PJ
140.433 TWh
3
ENERGY - CONSUMPTION
3_1 Consumption – SECTOR
GRAPH g02-1
world / 2023
Total final CONSUMPTION by SECTOR, World 2023
TOTAL:
428.771 PJ
119.104 TWh
world / 2023
Total final CONSUMPTION by SECTOR, World 2023
TOTAL:
428.771 PJ
119.104 TWh
3_2 Consumption – SOURCE
GRAPH g02-2
world / 2023
Total final CONSUMPTION by SOURCE, World 2023
TOTAL:
426.919 PJ
118.590 TWh
TOTAL non Electricity:
336.014 PJ
93.338 TWh
world / 2023
Total final CONSUMPTION by SOURCE, World 2023
TOTAL:
426.919 PJ
118.590 TWh
TOTAL non Electricity:
336.014 PJ
93.338 TWh
2
ELECTRICITY Consumption
2_1 e-Consumption – SECTOR
GRAPH g03-1
world / 2023
ELECTRICITY CONSUMPTION by SECTOR, World 2023
TOTAL:
90.866 PJ
25.241 TWh
world / 2023
ELECTRICITY CONSUMPTION by SECTOR, World 2023
TOTAL:
90.866 PJ
25.241 TWh
1
ELECTRICITY Generation
1_1 e-Generation – SOURCE
GRAPH g03-2
world / 2023
ELECTRICITY GENERATION by SOURCE, World 2023
TOTAL:
107.789 PJ
29.941.435 GWh
29.942 TWh
world / 2023
ELECTRICITY GENERATION by SOURCE, World 2023
TOTAL:
107.789 PJ
29.941.435 GWh
29.942 TWh
1_2 e-Total Generation
GRAPH g03-3
world / 2023
Total ELECTRICITY GENERATION, World 2023
TOTAL:
108.438 PJ
30.121.729 GWh
30.122 TWh
world / 2023
Total ELECTRICITY GENERATION, World 2023
TOTAL:
108.438 PJ
30.121.729 GWh
30.122 TWh
1_3 e-Renewable Generation – SOURCE
GRAPH g04
world / 2023
Renuable ELECTRICITY GENERATION by SOURCE, World 2023
TOTAL:
30.414 PJ
8.448.255 GWh
8.448 TWh
world / 2023
Renuable ELECTRICITY GENERATION by SOURCE, World 2023
TOTAL:
30.414 PJ
8.448.255 GWh
8.448 TWh
title
Energy Flow 2011

subtitle
gaya
date
2018 01 [source 2011]
caption
2011 WORLD_534.000PJ [148.335 TWh]
year: 2011
units: PJ
CONVERSION 1 PJ Petajoule = 0,27778 TWh 1 TWh terrawatthour = 3,6 PJ
LLNL- graph: All quantities are rounded to 2 significant digits, annual flows of less than 0.05 PJ are not included. Totals may not equal sum of flows due to statistical differences.
this GRAPH: The graphical representation may differ slightly from the numbers due to rounding. % percentages deriven from rounded numbers of template diagram [g01].
data source
LLNL Lawrence Livermore National Laboratory
[g01] World energy flow, 2011
https://flowcharts.llnl.gov/commodities/energy
additional information:
IEA International Energy Agency
[ ] World Balance / World Total Consumption, 2015
http://www.iea.org/Sankey/
[g01] World energy flow, 2011
https://flowcharts.llnl.gov/commodities/energy
additional information:
IEA International Energy Agency
[ ] World Balance / World Total Consumption, 2015
http://www.iea.org/Sankey/
< 1.2 World Energy Flow 2011
source
5
DATA SOURCES
5_1
data source:
IEA [International Energy Agency], 2015, Energy Balance flow
[Balance, Total Final Connsumption]
IEA [International Energy Agency], 2015, Energy Balance flow
[Balance, Total Final Connsumption]
4
SOURCES
4_1
unit: PJ, is in petajoules. 1 petajoule = 1 quadrillion joules.
All quantities are rounded to 2 significant digits and annual flows of less than 0.05 PJ are not included. Totals may not equal sum of flows due to statistical differences. Domestic supply includes changes in stocks. Further detail on how all flows are calculated can be found at http://flowcharts.llnl.gov. LLNL-MI-410527. Source: LLNL 2014.
534.000 PJ production
210.000 PJ consumtion [42%]
290.000 PJ rejected energy [58%]
Transportation rejected energy [80%]
210.000 PJ consumtion [42%]
290.000 PJ rejected energy [58%]
Transportation rejected energy [80%]
3
SOURCES
3_1
data source:
IEA [International Energy Agency], 2015, Energy Balance flow
[Balance, Total Final Connsumption]
IEA [International Energy Agency], 2015, Energy Balance flow
[Balance, Total Final Connsumption]
ENERGY PRODUCTION:
Fig. WORLD Balance [produnction/ consumption]
by sector [BAL]_2015
799592 PJ_production
392871 PJ_consumption
406750 PJ_rejected endergy = 49%
Fig. WORLD Balance [produnction/ consumption]
by sector [BAL]_2015
799592 PJ_production
392871 PJ_consumption
406750 PJ_rejected endergy = 49%

ENERGY CONSUMPTION:
Fig. WORLD Total final consumption
by sector [TFC]_2015
392871 PJ
Fig. WORLD Total final consumption
by sector [TFC]_2015
392871 PJ

2
.
1
.
Exhibition
April 26th, 2026


